MARKETING INSIGHTS ANALYS
Introduction
In today's competitive market landscape, data-driven decision-making is essential for businesses to optimize operations and enhance customer engagement. This analysis leverages a comprehensive dataset comprising 9,994 transactional records to extract meaningful marketing insights. The dataset includes key attributes such as shipping mode, customer segmentation, geographic details, product categories, and financial metrics (sales, quantity, discount, and profit).
By analyzing this dataset, we aim to uncover patterns in customer purchasing behavior, regional sales performance, and profitability trends. Additionally, evaluating discount strategies and their impact on revenue will provide actionable insights for refining pricing and promotional approaches. The findings from this analysis will support strategic marketing decisions, helping businesses improve customer targeting, operational efficiency, and overall profitability.
Below is a short information about our data set
Dataset Overview
This dataset contains 9,994 records, each representing a transaction with various attributes related to sales, geography, product categories, and financial performance. Below is a detailed explanation of each column and its data type:
About dataset

Marketing Insights Analysis
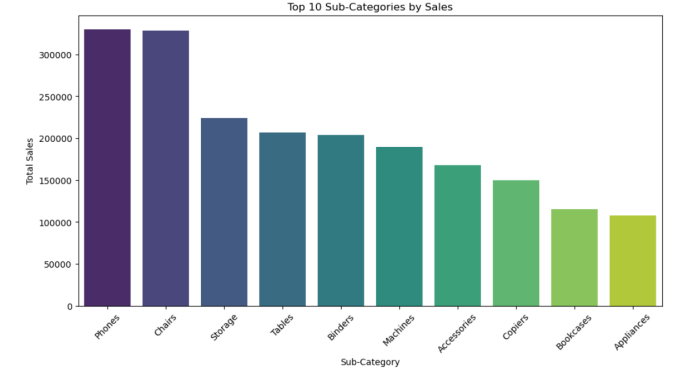
Our analysis began by identifying the top-performing products based on total sales. Phones and chairs emerged as the best-selling products, followed closely by storage, tables, and binders, which completed the top five. These products contributed significantly to overall revenue, indicating strong customer demand. However, sales volume alone does not always translate to profitability, so we examined the most profitable products separately. Interestingly, copiers, accessories, and binders ranked among the most profitable items, even though they were not among the top five in sales. This suggests that while some products generate higher revenue, others contribute more to the company's bottom line due to better profit margins. Understanding these differences is crucial for refining marketing strategies, ensuring resources are allocated effectively, and maximizing overall profitability.

To explore this further, we analyzed the relationship between sales and profitability, revealing a slightly positive correlation. While higher sales generally led to higher profits, this was not always the case for individual products. To gain a more precise understanding, we calculated the sales-to-profitability ratio for each product, allowing us to pinpoint items that delivered the highest returns relative to their sales volume. Surprisingly, labels had the highest ratio despite not being a top-selling product. This finding indicates a potential opportunity for the marketing team to shift focus toward promoting highly profitable but underperforming products. By increasing sales of such items, the company can enhance overall profitability without necessarily driving higher overall sales volume. This insight underscores the need for a data-driven approach in marketing efforts, ensuring that promotional strategies are aligned with profit optimization rather than just revenue growth.


Further examination of customer demographics revealed that the consumer segment accounted for the largest share of our sales. Additionally, most transactions were concentrated in California, New York, and Texas, making these regions key focus areas for future marketing initiatives. By leveraging these insights, we can refine our promotional strategies, optimize pricing, and target the most profitable customer segments more effectively.


CONCLUSION
Our analysis revealed key insights into sales and profitability trends. Phones and chairs were the top-selling products, while copiers, accessories, and binders ranked highest in profitability, despite lower sales. A deeper look at the sales-to-profitability ratio showed that labels had the highest return relative to sales, presenting an opportunity to focus marketing efforts on high-margin products rather than just high-revenue ones.
Additionally, the consumer segment dominated our customer base, with most sales concentrated in California, New York, and Texas. These regions and segments should be prioritized for targeted marketing strategies to maximize revenue and profitability.

Comments
Post a Comment